In 1859, the English mathematician Arthur Cayley published a note in the Philosophical Magazine, entitled On Contour and Slope Lines, in which he examined the structure of topographical patterns. In a follow-up article, On Hills and Dales, James Clark Maxwell continued the discussion. He derived a result relating the number of maxima and minima on a contour chart.
Both authors introduced colourful terms for the topographical features. We will call maxima Peaks, minima Pits and saddle-points Passes, so we can speak of the connection between the numbers of Peaks, Pits and Passes. The results of Maxwell imply the relationship
[# of Peaks] – [# of Passes] + [# of Pits] = 2
Maxwell distinguished between what he called “Passes” and “Bars”, but I think that this is unnecessary. The formula here is very reminiscent of Euler’s famous polyhedron formula
V – E + F = 2
where V is the number of vertices in a polyhedron, E is the number of edges and F the number of faces. Euler’s formula also holds for any network drawn on a sphere. It is valid too for a network on a plane surface, provided we include the exterior region in the count of faces.
For a topographical map, we can construct a polyhedron in the following way: we join the peaks by “edges” passing through the saddle points or passes. If all peaks are joined in this way it turns out that each closed cycle surrounds a minimum, or Pit. So, V, E and F now correspond to the number of peaks, passes and pits on the chart; for simplicity, we assume that the chart covers the entire globe. So, Maxwell’s result is a particular example of Euler’s polyhedron formula.
The Highs and Lows of Weather Maps
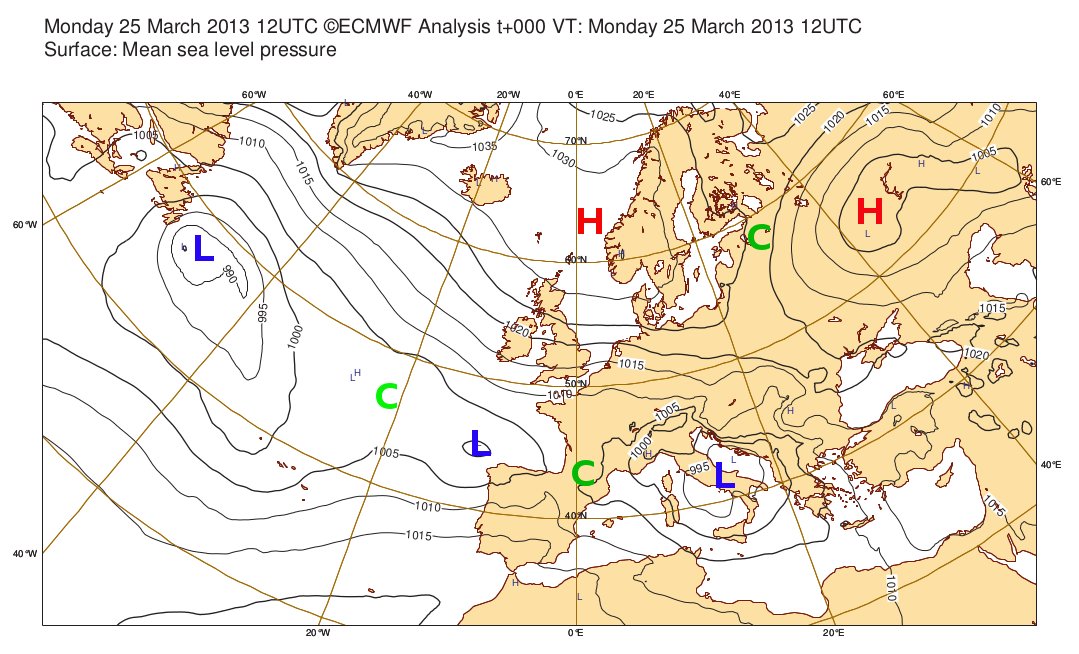
The characteristics of maxima and minima on topographic maps are also relevant for weather charts. We consider an isobaric chart of atmospheric pressure. It is customary to mark the pressure maxima and minima, as they represent centres of anticyclones and depressions. The saddle-points are referred to as cols. Suppose there are H anticyclones, L depressions and C cols. Then, joining centres of anticyclones by lines through cols, we find a relationship equivalent to Euler’s formula:
H – C + L = 2
The simplest nontrivial configuration is a High at the North Pole, a Low at the South Pole and no cols. This may be expressed as an interesting, but unsurprising, mathematical result:
1 + 1 = 2
Now suppose the anticyclone splits into two parts, so that there are two maxima. This cannot happen without the formation of a col between the two maxima, so the formula becomes 2–1+1=2. In general, every time we split a high or low into two extremes, a col is created; and every time two high or low centres merge, a col is annihilated. So the relationship H – C + L = 2 continues to hold.
More Topological Implications for Weather.
There is a beautiful topological theorem called the Hairy Ball Theorem. For the ordinary 2-sphere, if f is a continuous function that assigns a vector to every point p on a sphere such that f(p) is always tangent to the sphere at p, then there is at least one p such that f(p) = 0.
In other words, you can’t comb a hairy ball flat without creating a cowlick: there will always be at least one tuft of hair on the ball. The theorem was first stated by Poincaré, and proved in 1912 by the Dutch mathematician Luitzen Brouwer.
The wind field is a vector field on the sphere. The Hairy Ball theorem implies that it cannot be windy everywhere: there is always at least one point on the globe where the wind vanishes.
Another topological theorem, the Borsuk-Ulam Theorem, also has meteorological implications. In two dimensions, it states that every continuous function from the sphere to the plane maps some pair of antipodal points (points in exactly opposite directions from the sphere’s center) to the same point.
The theorem was first proved by Karol Borsuk (1933), who attributed the formulation of the problem to Stanislaw Ulam. There are several corollaries of the Borsuk-Ulam Theorem: the colourfully-named Ham Sandwich Theorem and the Brouwer Fixed-point Theorem both follow from it.
The Borsuk-Ulam Theorem means that if we have two fields defined on a sphere, for example temperature and pressure, there are two points diametrically opposite to each other, for which both the temperature and pressure are equal. Also, there must be two diametrically opposite points where the wind blows in exactly opposite directions.
References:
Cayley, Arthur (1859). On Contour and Slope Lines. The Philosophical Magazine 18 (120), 264-268. PDF
Maxwell, James Clerk (1870). On Hills and Dales. The Philosophical Magazine 40 (269), 421–427. PDF
Topology: Wikipedia article http://en.wikipedia.org/wiki/Topology
