Seventy percent of the Earth is covered by water and three quarters of the world’s great cities are on the coast. Ever-rising sea levels pose a real threat to more than a billion people living beside the sea. As the climate warms, this is becoming a greater threat every year [TM113 or search for “thatsmaths” at irishtimes.com].

Water levels are important in numerous contexts: storm surge prediction, ship navigation, bridge clearances, depths on nautical charts, flood protection, coastal infrastructure and defences, and so on. It is crucial to monitor sea levels and to anticipate future changes by using computer simulations of the ocean.
Measuring Sea Level
How do we measure sea level? It is not so simple: the sea surface is a moving target, rising and falling with the tides and weather. Ocean currents are dynamically linked to sea surface topography and changes in currents and water density result in sea level changes.
The position of a point is fixed by giving its latitude, longitude and altitude. Satellites measure the level of the ocean surface from a position that is precisely known relative to the centre of the Earth. Satellite altimetry is astoundingly accurate and had enabled us to monitor sea levels in the open ocean across the globe. Observations show that sea levels have been rising steadily.
Sea levels are measured relative to a reference level known as a geodetic datum. Tide gauges give the water level relative to this datum, so changes in level are measured relative to local land elevations. Most European countries use a datum known as the European Vertical Reference Frame 2007. For some reason, Ireland is not listed amongst the countries using this reference.
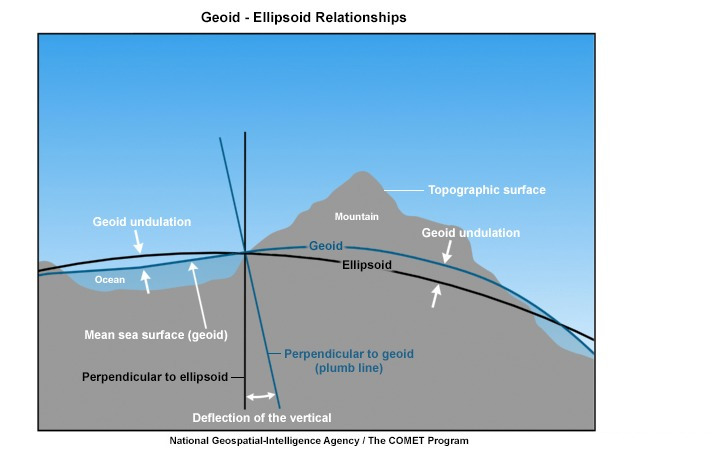
From space, the Earth appears smooth and round but it bulges at the equator and mountains and ocean trenches result in variations up to 10 km above and below mean sea level. We can model the Earth by a flattened sphere called an oblate spheroid or ellipsoid but, because of variations in gravity, this is not a level surface. Rivers may actually flow “uphill” relative to the ellipsoid.
A geoid is a surface closer to the Earth’s shape, upon which the gravitational force is constant. The local vertical direction may not point towards the centre of the Earth but is is always perpendicular to the geoid, which corresponds closely to the mean sea level.
Melting and Expansion
Changes in global mean sea level result from changes in the total volume of water in the oceans. There are two major contributions to this: increased water mass due to melting of ice-caps and glaciers, and thermal expansion due to increasing temperature as the climate warms. Over the past century, global sea level has been rising at about 3 mm each year, or about 30 cm over the century. This is one of the gravest threats associated with climate change. Over the coming century, most of our coastal cities will require substantial shoreline protection.
Andrew Parnell of the School of Mathematics and Statistics, UCD, is a coauthor of a recent paper in the world-renowned journal Science, ‘Regional and global sea-surface temperatures during the last interglaciation’. The paper describes a reconstruction of temperature patterns during the last inter-glacial period, about 120,000 years ago. The temperature estimates are similar to today, but sea levels during this period were 6 to 9 metres higher than present levels.
This is worrying, as it indicates that global warming may lead to a continuing rise in water level. We may be committed to substantial sea level rise over the coming decades even if there is no further warming of the atmosphere.
