Reports of the length of Ireland’s coastline vary widely. The World Factbook of the Central Intelligence Agency gives a length of 1448 km. The Ordnance Survey of Ireland has a value of 3,171 km (http://www.osi.ie). The World Resources Institute, using data from the United States Defense Mapping Agency, gives 6,347km (see Wikipedia article [3]).
Fractals
How come the values differ so much? It is because the coastline is fractal in nature and the measured length depends strongly on the “ruler” or unit of length used. A straight line – like a road – has dimension 1 and a plane surface – like a field – has dimension 2. But some curves – like coastlines – are so wiggly that they have a dimension between 1 and 2. Such curves, with fractional dimensions, are called fractals.
An early example of a fractal curve is the Koch snowflake, which first appeared in a 1904 paper titled “On a continuous curve without tangents, constructible from elementary geometry” by the Swedish mathematician Helge von Koch. It is built up by repeatedly subdividing the sides of an equilateral triangle into three parts and erecting a smaller triangle on the central segment. Here are the first four stages:
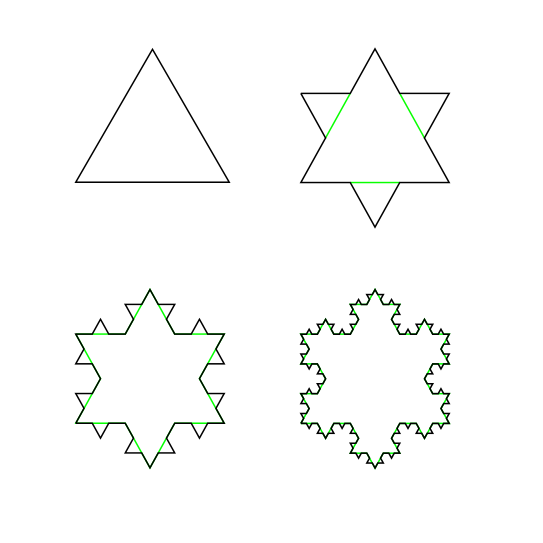
The length of the snowflake grows without limit as the subdivision process continues: each step adds one third to the length, so at stage N it is (4/3)N times the length of the original triangle, growing exponentially with N. The fractal dimension of the snowflake is log 4 / log 3 ≈ 1.26.
Richardson’s Scaling Law
Fractals were considered by the English Quaker mathematician Lewis Fry Richardson. When he measured the length of the west coast of Britain, his estimates varied widely with the scale of the map he was using. Larger scale maps include finer detail, resulting in a longer coastal length. As we may choose to include variations corresponding to every rock, pebble or grain of sand, it is impossible to assign a length unequivocally. All we can do is to describe how the length varies with our unit of measure.
Richardson measured the coastal length by walking dividers with fixed distance Δ along a map. He found that the dependence of measured length L on the distance Δ was
L = C x Δ (1-D)
For a very smooth coast like that of South Africa, D ≈ 1. For more convoluted coastlines, D > 1 and so L increases as Δ decreases. Richardson found that the west coast of Britain yielded a value D = 1.25, close to the dimension of the snowflake.
Ireland’s Coastline
Recently a group of students in the School of Physics, Trinity College Dublin, under the supervision of Professor Stefan Hutzler, studied Ireland’s coastline using Google Maps and a measure called the box dimension: the length of a curve is estimated by superimposing a square grid on it and counting the number N of grid boxes that contain a segment of the curve. For a smooth curve, the product of N and the width W of a box is insensitive to the width of the box, and gives an estimate L = N x W of the length of the curve. For fractal curves, the length increases as the box width is reduced. The figure below, taken from the Science Spin article [1] shows the idea.
![The Kerry coast with superimposed coarse grid (left) and fine grid (right). Only boxes intersecting the coast are shown (from [1]).](https://thatsmaths.com/wp-content/uploads/2013/12/box-dimension.png)
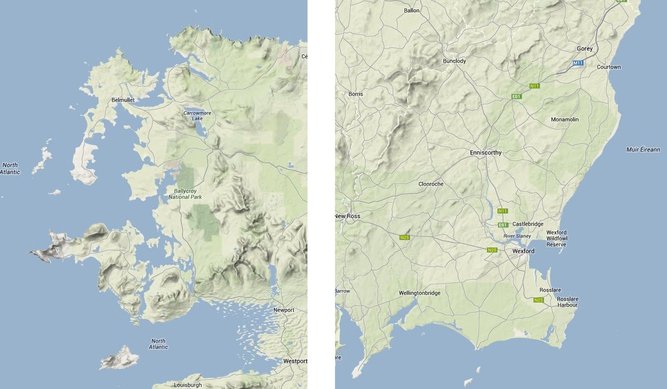
Hutzler obtained a value D = 1.20 for the fractal dimension. Not surprisingly, the ragged Atlantic shore has a higher fractal dimension (D = 1.26) than the relatively smooth east coast (D = 1.10). We can see this visually by comparing the coasts of Mayo in the North-west and Wexford in the South-east:
Independently, and using a different method, a group in the School of Computing and Mathematics, University of Ulster, used printed maps and dividers of varying length (see McCartney, Abernethy, and Gault [2]). This yields what they call the divider dimension. The graph below shows the measured length as a function of divider length.
![Log-log plot of length versus step-size (from [2]).](https://thatsmaths.com/wp-content/uploads/2013/12/fractal-coast.jpg)
The points lie close to a line on this log-log plot, and the slope m of the line gives the fractal dimension: D = 1 – m. McCartney et al. obtained a value D = 1.23 for the overall coastline. They found that the relationship
L = 15,550 X Δ -0.23
held for step sizes over three orders of magnitude, between 100m and 100 km (note that L is in km and Δ is in metres). This implies values in the following table:
-
Stepsize Δ
Length L
1 metre
15,550 km
10 metres
9,157 km
100 metres
5,392 km
1 km
3,175 km
10 km
1,870 km
100 km
1,100 km
We see from this table that the value of 3,171 km given by the Ordnance Survey of Ireland corresponds to a step size of 1km.
The close agreement between the two independent studies [1] and [2] confirms our ideas about the fractal nature of the Irish coastline and gives us confidence in the reported values of D.
Sources
[1] Hutzler, S. (2013). Fractal Ireland. Science Spin, 58, 19-20
[2] McCartney M., Abernethy G., and Gault L. (2010). The Divider Dimension of the Irish Coast. Irish Geography, 43, 277-284.
[3] Wikipedia article: List of countries by length of coastline.
Peter Lynch’s book about walking around the coastal counties of Ireland is now available as an ebook (at a very low price!).
 For more information and photographs go to http://www.ramblingroundireland.com/
