Suppose the population of the world is described by the equation
Then grows exponentially:
. This was the nightmare prediction of Thomas Robert Malthus. Taking a value
for the growth rate, we get a doubling of population every 35 years. The actual population from 1970 to 2015 doubled from 3.7 billion to 7.3 billion over a 45 year period.
For any physical growth, there are always limiting factors. For the human population, we could cite the availability of food and water as major factors. A simple way to include controlling factors is to add a quadratic term with negative coefficient:
 This is called the logistic equation, orVerhulst Equation. The right-hand side of the logistic equation is positive for
 . If
and the initial population
are small, the growth is close to exponential but, as population increases, the right-hand side of the equation reaches a maximum when
and then decreases to zero when
, when no further growth occurs.
The logistic equation is nonlinear. Normally, such equations cannot be solved in analytical form. However, this equation is an exception. Through a transformation of variables (for details, see Strang, 1986), we can uncover the explicit solution
The population increases to an asymptotic value for large time, following an S-shaped curve, as shown in the Figure at the head of this article. Here, the initial population is one billion,
and
, so the population asymptotes to 10 billion, getting close to the limiting value in about two centuries.
By a simple change of variables, we can transform the solution to the standard form of the logistic function:
where
is the supremum, or limiting value, of
.
is the logistic growth rate of the curve.
is the central time (where
.
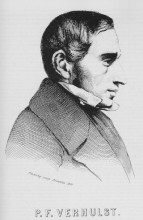
The logistic model was introduced by Pierre François Verhulst in 1838 as a model of population growth.
The Logistic Map
Most nonlinear differential equations cannot be solved analytically, so a numerical approach is employed. If we discretise the time, the Verhulst equation can be written as:
where and
is the growth rate. For
the map sends the unit interval [0,1] into itself. This is a difference equation of second degree. It is frequently used to show how chaotic behaviour can arise in simple nonlinear dynamical systems.

. The period-3 band starting at
is clear [image from Wikimedia Commons].
The following list illustrates the wide variety of behaviours of the solutions and how they depend critically on the value of the parameter and, in the chaotic regime, on the initial conditions.
- For
, the solution tends to zero for all initial conditions.
- For
, the solution tends rapidly to
for all initial conditions.
- For
, the solution tends eventually to
, after oscillating about that value for some time.
- For
, the solution approaches a period 2 cycle, oscillating betweeen two values.
- For increasing
, solutions with successive doublings of period, 4, 8, 16, \dots, are found.
- at
, chaos emerges at the end of the period-doubling cascade. Minute changes of initial conditions result is widely different solutions.
- at
, a stable period 3 cycle emerges.
There is a much richer spectrum of solution types than listed here. The bifurcation diagram in the Figure above gives a flavour of the complexity of the system. Most books on chaos and dynamics give a more exhaustive description of the solutions; see, for example Ott (1993).
Trailer
Next week, That’s Maths will post an article about Oleksandr Sharkovsky and his discovery of the remarkable sequence of solutions found in simple nonlinear dynamical systems. This will be followed the following week by a note on the Sharkovsky Ordering.
Sources
Ott, Edward, 1993: Chaos in Dynamical Systems. Cambridge University Press, 385pp. ISBN: 9-780-5214-3799-8.
May, R., 1976: Simple mathematical models with very complicated dynamics. Nature, 261, 459–467 (1976). https://doi.org/10.1038/261459a0
Strang, Gilbert, 1986: Introduction to Applied Mathematics. Wellesley-Cambridge Press, 758pp. ISBN: 0-961-40880-4.
