Maths frequently shows us surprising and illuminating connections between physical systems that are not obviously related: the analysis of one system often turns out to be ideally suited for describing another. To illustrate this, we will show how a surface in three dimensional space — the hyperbolic paraboloid, or hypar — pops up in unexpected ways and in many different contexts.
![Warszawa Ochota railway station, a hypar structure [Image Wikimedia Commons].](https://thatsmaths.com/wp-content/uploads/2014/05/hypar-roof-mid-res.jpg)
[Image Wikimedia Commons].
Curves and surfaces
In two dimensions a point 


Moving up a notch, a point 


To describe a curve in 3-space, we need to reduce the dimensionality once more, by giving a second equation, 
The most ancient and best-understood curves are the conic sections, the ellipse, parabola and hyperbola, arising from the intersection of a plane and a cone. Intensively studied since ancient times, they apply to an enormous range of physical systems, ranging from radar scanners to planetary orbits.
Curves in space
All the curves considered so far are flat: they lie in a plane. But what if both intersecting surfaces are nonlinear? Then the intersecting curve can twist around in 3-space like a roller-coaster and not lie flat in a plane. Let’s consider the case of two cylinders, each with circular cross-section, whose axes are orthogonal and intersect at a point.
If the equations for the two cylinders are added, we obtain the equation of an oblate spheroid, a sphere flattened like an orange. If they are subtracted, we obtain an equation representing two planes. The actual intersection of the cylindrical surfaces comprises two ellipses. This may seem abstract, or even abstruse, but two perpendicular barrel vaults in a classical building intersect in this way, and we can clearly see the elliptical curves in the resulting groin vault.
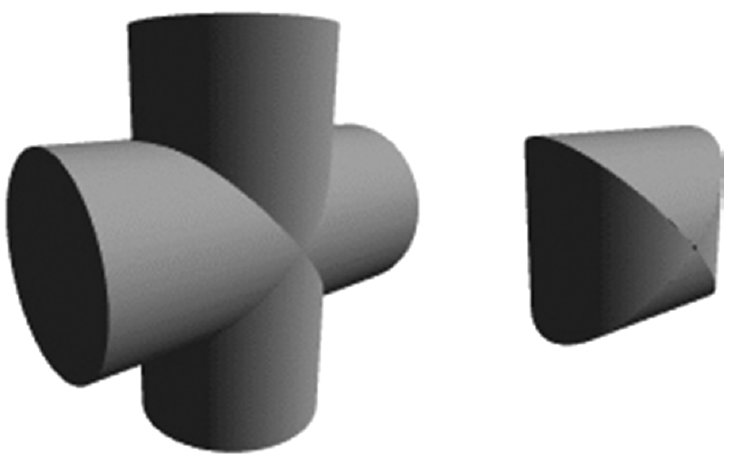
perpendicular cylinders consists of two ellipses. The volume of the intersection is called a bicylinder.
The volume common to two cylinders of equal radii with orthogonal intersecting axes, called a bicylinder, was known to Archimedes, and also to the Chinese mathematician Tsu Ch’ung-Chih. In the fifth century, Tsu Ch’ung-Chih used it to calculate the volume of a sphere [Kiang72].
If we want to obtain a curve on a sphere, we can `flatten’ the cylinders so that they have elliptical cross-sections. Moreover, let’s displace the two cylinders along the axis orthogonal to both of them, one upward and one downward. Their equations are

Adding and subtracting these two equations, we get

These are the equation for a sphere of radius 

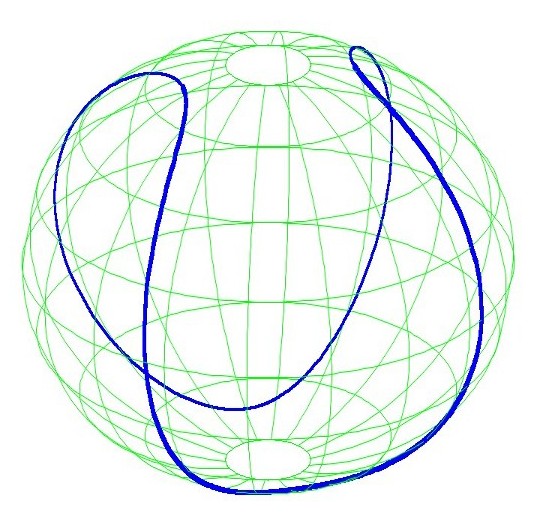
In the above figure we plot the curve determined by the intersection of the sphere and hypar. It resembles the seam on a baseball or the groove on a tennis ball. The hyperbolic paraboloid is also the shape of the snack food called pringles and the edge of a pringle is like the tennis ball curve.
In addition to its use in classical buildings, the hypar has proved useful in modern architecture. The advent of shell construction in the 20th century and the mathematical theory of surfaces allowed very thin, strong vaults to be constructed using the hypar form. Because it is a `ruled surface’, generated by straight lines, saddle-shaped roofs of this form are easily constructed from straight sections [see figure at head of this post].
From tennis balls to weather forecasts
The groove on a tennis ball curve is not defined explicitly, and may be approximated in many ways. The official rules of the game are not much help, stating only that: “The ball shall have a uniform outer surface of a fabric cover and shall be white or yellow in colour. If there are any seams, they shall be stitchless” (ITF Rules of Tennis 2012).
The challenge is to construct a cover for the spherical ball from two flat pieces of felt. The great mathematician Carl Friedrich Gauss showed that to do this exactly is impossible: there is no exact mapping from a plane to a sphere. But, in practice, the felt flats are shaped like peanuts and, with a little stretching, fit snugly on the ball.
Many models of the tennis ball curve have been proposed. Indeed, the ingenious and versatile mathematician John Conway formulated a conjecture: No two definitions of `the correct curve’ will give the same answer unless their equivalence is obvious from the start. Indeed, the curve found on tennis balls is well approximated by a combination of four circular arcs [Banks99]. While this solution may appeal to engineers, it is unattractive to mathematicians, for the composite curve does not have nice analytical properties. The curve formed from the intersection of the sphere and hypar has an elegant mathematical equation.
The tennis ball curve arises from the practical need to cover the ball with flat felt. But the resulting partition of the sphere turns out to have another very practical use. In weather forecasting, we have to represent the atmosphere using a grid of points that cover the globe. The usual geographical latitude and longitude coordinates cause big problems: the meridians converge towards the poles, so the coverage with a latitude/longitude grid is highly non-uniform.
By dividing the sphere into two parts by means of the tennis ball curve, and using a separate grid on each part, we avoid the difficulties. This solution is called the Yin-Yang Grid [Kageyama05], as it is reminiscent of the ancient Chinese symbol of that name.
Sources
Kageyama, A., 2005. Dissection of a sphere and yin-yang grids. J. Earth Sim., 3, 20-28.
Kiang, Tao (1972). An old Chinese way of finding the volume of a sphere. Math. Gazette, 56, 88–90. Reprinted in The Changing Shape of Geometry, Ed. C. Pritchard, Camb. Univ. Press (2003).
Banks, Robert B (1999). Slicing Pizzas, Racing Turtles, and Further Adventures in Applied Mathematics. Princeton Univ. Press, 286pp.
Gray, Alfred (1998). Modern Differential Geometry of Curves and Surfaces with Mathematica. CRC Press, 1053pp.
* * * * * *
This post is a preliminary version of a chapter in the book published for the 50th anniversary of the Institute for Mathematics and its Applications (IMA):
 50 Visions of Mathematics, Edited by Sam Parc, Foreword by Dara O’ Briain. Oxford Univ. Press, 208 pages, ISBN 978-0-19-870181-1
* * * * * *
 Peter Lynch’s book about walking around the coastal counties of Ireland is now available as an ebook (at a very low price). Order now from amazon. For more information and photographs go to http://www.ramblingroundireland.com/
